
This is the second post of our two-part series. For the first post, click here: https://focus.sva.de/how-to-analyze-your-iot-mqtt-data-with-splunk-and-hivemq/
In the first post, we gave a brief overview of the typical challenges in analyzing IoT Data and the technologies that help solving them when paired with our latest piece of software. In this second part, which mainly addresses practitioners, we will explain the architecture, set up and technical details of our extension and possible ways to leverage it with hands-on use cases and demo dashboards.
Smooth integration by natively extending HiveMQ
For maximum cohesion with the existing HiveMQ ecosystem, the HiveMQ-Splunk Extension is written in Java leveraging built-in functions from the HiveMQ Extension SDK, with Gradle as the standard build tool. The only tiny deviation is the format of the configuration-file, which is a .json-file and not the usual .xml-file.
Image 2 displays a schematic overview of an exemplary configuration and the resulting set up of the communication between HiveMQ and Splunk HTTP Event Collectors (HECs).
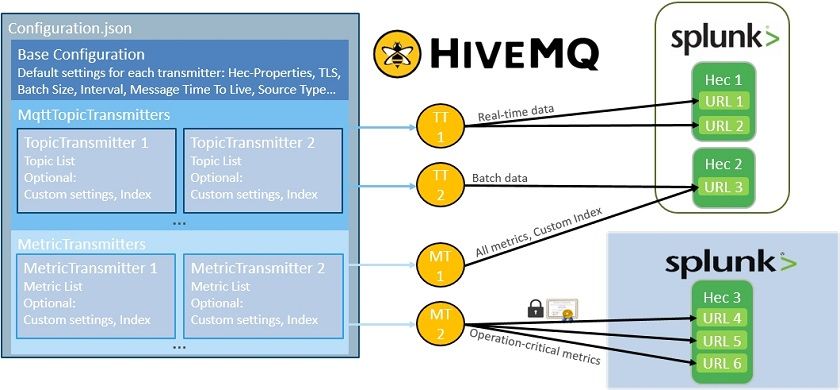
Image 1: Fine-grained architecture showing the mapping of elements from the Extension Configuration to their Extension objects, Topic Transmitters (TT) and Metric Transmitters (MT), in the HiveMQ-Cluster and communication routes to various Splunk HECs.
The composition of our extension mainly depends on its main configuration (left object in Image 2), which is defined in a nested .json-file. Its top layer consists of the Base Configuration, which keeps a set of standard settings for all eligible transmitter objects. The next layer contains the Transmitter Configurations and is separated into two sections, according to the transmitter type, which consist of specific configuration options for each individual transmitter. For every Transmitter defined in the configuration-file there is a dedicated object created in every Node that belongs to a HiveMQ-Cluster, which is pictured here by the rectangle in the mid-section. Depending on their configuration, Topic Transmitters will push MQTT-Messages to a certain Splunk HEC on one or more Nodes of a Splunk Deployment. Metric Transmitters will forward operational metrics to Splunk, which are specific to their HiveMQ-Instance. Receiving Splunk-Instances don’t necessarily need to belong to the same Cluster. In this exemplary configuration Metric Transmitter 2 is a dedicated transmitter, which reports HiveMQ-Metrics to a cloud-based Splunk Instance belonging to an external service provider that supports the internal IT in operating the IT-Infrastructure.
The high granularity of the extension’s configuration allows for the adaption to all kinds of customer-specific requirements and distributed architectures. Topics, metrics, batch sizes, transmission intervals and message retention times can be configured globally for all transmitters or independently for each transmitter. It is possible to split workloads across multiple HiveMQ-Instances, Splunk Indexes and Endpoints. A flexible configuration of content and source types supports for different message types and formats. Communication between Extension Transmitters and Splunk HECs is conducted in a REST-based manner, using the standard Json-over-http mechanism. Traffic can be encrypted or unencrypted by individual choice for each transmitter and endpoint. The same flexibility applies for certificate-based authentication and User Management, as both Splunk and HiveMQ both support common directory services such as Active Directory or LDAP.
Hands-on example 1: Monitoring your manufacturing equipment with HiveMQ and Splunk
To give a practical demonstration of the capabilities of HiveMQ in tandem with Splunk enabled by our extension, we focus on an industrial manufacturing use case. At the plant of a medium-sized automotive components supplier, a holistic solution was required to transparently calculate production KPIs and monitor the state of an industrial production line, consisting of two CNC drilling and milling machining centers and one varnishing machine. The industrial equipment was connected to HiveMQ, using the SVA Factory Data Bridge, a machine connectivity software running on IoT gateways that translates field protocols like OPC-UA or Modbus to MQTT. The Factory Data Bridge publishes data from the machine’s programmable logic controllers (PLCs) to HiveMQ, where it is forwarded to a Splunk Endpoint via the extension. Here, the data is being indexed and prepared for analyzation. Afterwards, various insights through visualizations and Key Process Indicators (KPIs) can be derived from it.
At first, we define a base configuration with standard parameters, which will be the default settings for any specific transmitter that will be added afterwards:
{
"SplunkHecToken": "42f951c7-c4df-4e14-a30a-f905d4ee606b",
"SplunkHecUrlList": [
{
"SplunkHecUrl": "https://Splunk_Indexer1.bcc.de/services/collector",
"UseSsl": false
  },
  {
"SplunkHecUrl": "https://Splunk_Indexer2.bcc.de/services/collector",
"UseSsl": false
  }
],
"IntervalInMs": 10000,
"MaxSendingBatchCount": 50,
"MessageTTLInMs": 120000,
"ContentType": "application/json",
"SourceType": "http",
"ClusterName": "HiveMQ-Cluster Wiesbaden",
Then a Message-Transmitter is defined for every machine, which forwards MQTT-data to a dedicated indexer on the Splunk HEC. Each Message-Transmitter has its own configuration with a unique index to differentiate between the machines in Splunk, which is added to the configuration list. Below the example configuration for one of the drilling and milling stations is shown:
"MqttMessageTopicConfigurationList": [
  {
    "BrokerInputTopicList": [
      "Control/Status_ON","+/Part_loaded","+/Part_unloaded",
      "+/Status_ERROR","Operation_Mode/#"
    ],
  }
],
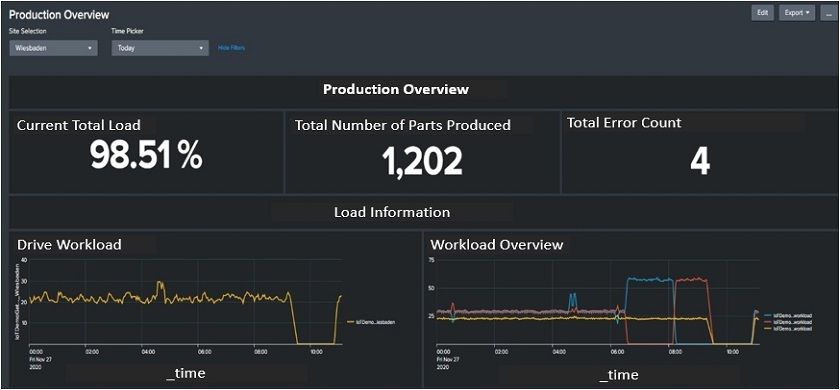
Image 2: Splunk Dashboard with production overview of loads, count of produced part and errors
It is also possible to aggregate that data into Key Performance Indicators (KPIs), which provide a more focused view for improvement and progress towards an intended goal. One of the most common production KPIs is the Overall Equipment Efficiency (OEE). It is very suitable for a quick overview of a machine‘s general state of affairs and to see if there is an issue which is hampering productivity. However, the OEE by its own is too highly aggregated for narrowing down where to actually locate the root cause of an issue. KPIs in order to perform a targeted analysis, it is necessary to look at the three key figures that make up the OEE:
- Availability: How much of a machine‘s theoretically possible maximum uptime is actually reached?
- Quality: How big is the share of parts that pass the quality check after processing compared to the total number of processed parts?
- Performance: How big is the share of successfully processed parts vs. the standard production rate? (expected number of processed parts under normal circumstances)
To achieve an optimum in comparability, it must be ensured, that all of these KPIs refer to the same period in time. To guarantee this, the Dashboard was designed to always display the three of them together over a given time span, which can be adjusted according to the user’s needs.
Taking a glance at the OEE in Dashboard 2, we can spot immediately that there is some grave issue at the respective machining center, since the OEE sits at a rather low level of 35%.
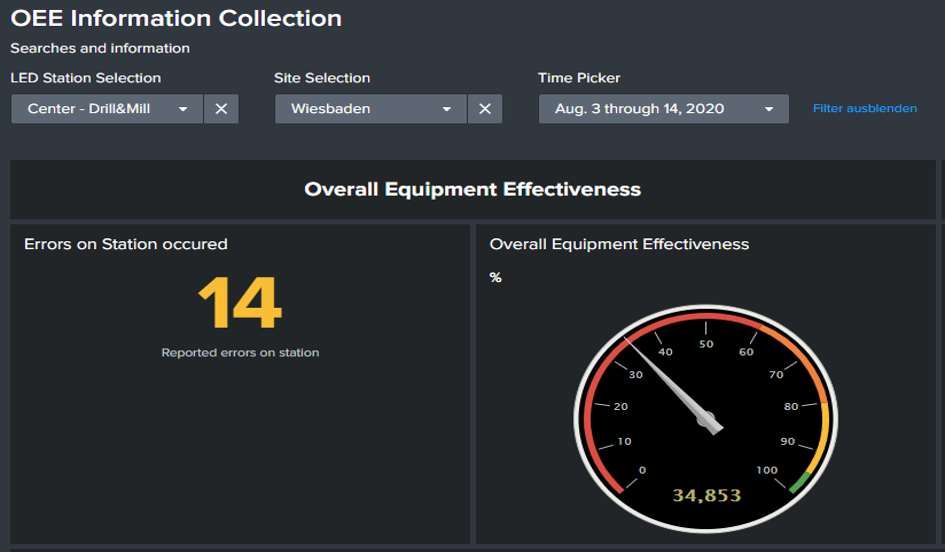
Image 3: Dashboard 2: Error count and visualization of Overall Equpiment Effectiveness for one of the Drilling & Milling Centers
To gain a better understanding of the circumstances, we then take a look at Dashboard 3 (Image 4), where the three underlying key figures of the OEE and related numbers, such as the MTTR (mean time to response) or MTBF (mean time between failure) are depicted. Now we have a slightly more concrete understanding of the situation: It seems that there is no issue with the machine’s uptime or the quality of the produced parts, but with the performance itself. This means, that the machine either operates way slower than it is supposed to or that it sits idle for longer than necessary between processing steps. Equipped with this knowledge, a purposeful investigation on the shopfloor can be conducted.
As it turned out in this case, the machine operator had to walk multiple times to the shop floor warehouse during his shift, because repeatedly there was an unnoticed planning error in the allocation of replenishments. During this time, production had to be halted. Once the cause was identified, it was very easy to inform the coworkers in charge of allocating supplies, so they could increase the stock levels of the intermediate storage in the machine’s direct vicinity accordingly.
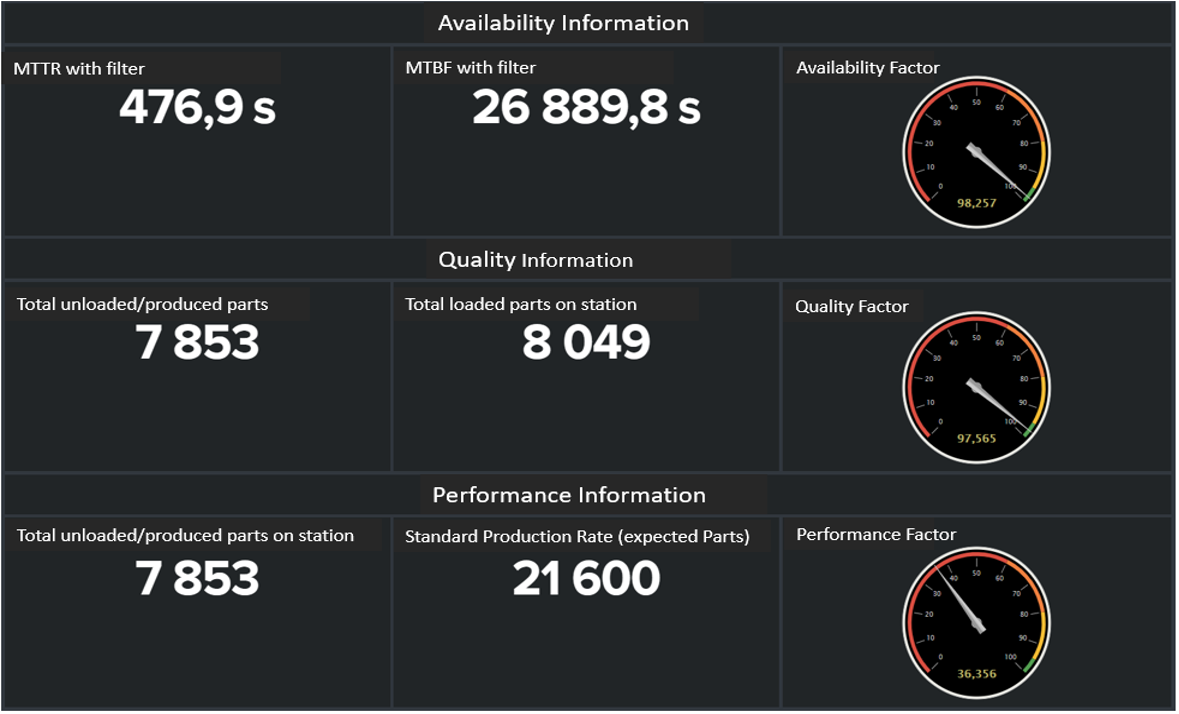
Image 4: Splunk Dashboard 3: Availability, Quality and Performance Information: This Dashboard gives a more detailed insight in the underlying KPIs of the OEE and their composition
Hands-on example 2: Monitoring the HiveMQ-Cluster itself with Splunk
Not only can the manufacturing facilities be managed more efficiently by applying connectivity and analytics in combination, but also the HiveMQ-Cluster itself. In order to send data about the state of our HiveMQ-Deployment to a seperate Splunk instance located in the data center of the corporate IT-department, we define a Metric Data Transmitter in the configuration-file. Since we need to establish a connection beyond the shop floor VPN to the network of the company’s headquarters a few miles away, we add certificate-based authentication as an additional security mechanism:
"HiveMqMetricDataConfigurationList": [
{
"SplunkHecToken": "14f90132-8177-46d1-a77a-5f731cc90721",
"SplunkHecUrlList": [
{
"SplunkHecUrl": "https://SplunkIT.bcc.de/services/collector",
"UseSsl": true,
"SslConfiguration": {
"SslCACert": "/Cert/CA.crt",
"SslClientCert": "/Cert/cl.crt",
"SslPrivateKey": "/Cert/priv.key",
"SslPassword": "***********"
}
}
],
"IntervalInMs": 60000,
"Index": "hivemqmetricdatae",
"HiveMqMetricList": [
"com.hivemq.networking.*",
"com.hivemq.messages.incoming.*",
"com.hivemq.jvm.garbage.collector.G1*",
"com.hivemq.jvm.memory.heap*"
]
}
The responsible administrators from the company’s IT Department can make easy use of the solution to monitor the HiveMQ-Broker and use Splunk to define dashboards and alert notifications in case of load peaks or downtimes. There is already a dedicated Splunk App available, which was built to complement our SVA HiveMQ-Splunk extension exactly for this scenario (Image 5).
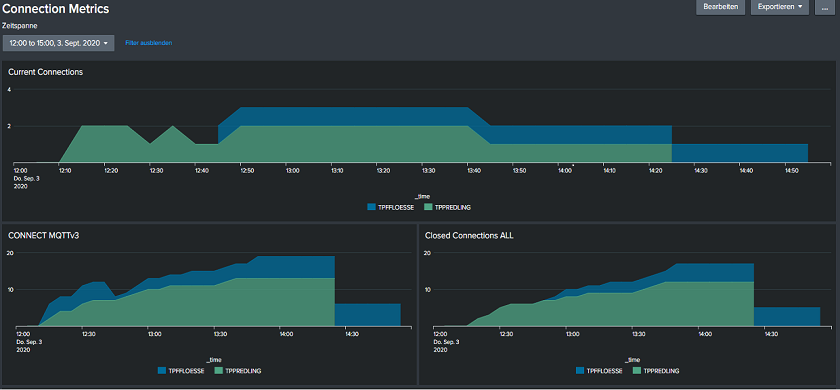
Image 5: HiveMQ Metric Dashboard – Connection Metrics: Shows the total number of currently active and closed MQTT-Connections to our HiveMQ-Broker and the Protocol Version of MQTT being used.
This way, it is easy to monitor all key figures related to the health of a HiveMQ-Broker and the Java Virtual Machine (JVM) it resides in. Tuning JVM-Parameters, such as heap size, is one of the most common levers to optimize or increase the performance of HiveMQ. By this approach, it is ensured that necessary shop floor data will be forwarded reliably to Splunk and other back end systems.
As shown in this post, HiveMQ and Splunk are a perfect match for keeping track of the state of field devices and analyzing the data they generate. The HiveMQ-Splunk Extension by SVA provides the missing piece, which is required to bridge the gap between these two powerful systems. As it seamlessly integrates with HiveMQ and uses Splunk’s native HTTP Event Collectors, it only takes a minimally invasive effort to deploy it into production settings and run it at scale. Therefore, it definitely helps our customers in solving a major challenge of nowadays IT-Architectures: Breaking data-silos and enabling true interoperability between systems and organizations.
Co-Author: Stanislav Khodorov