

In the first blog post of our Mainframe Optimization blog series, we explored the challenges organizations face when running z/OS environments: Mainframes are highly available enterprise computing systems designed to process massive volumes of data and transactions – powerful, but also highly complex. Combined with high software licensing costs, aging IT workforces, and constantly changing workloads, even small inefficiencies can have a substantial business impact.
In this blog post, we focus on one of the most critical aspects of mainframe optimization: effective LPAR management. This is a challenge that often arises when organizations lack reliable insights, accurate calculations, and continuous control of their environment. We will examine what successful LPAR management looks like in practice.
Mainframe Optimization through clear and actionable insights
One of the key questions we address in our performance analyses is how a z/OS LPAR is being supplied by PR/SM. One of the primary causes of resource bottlenecks is an inadequate supplement of processor resources to z/OS. If LPAR weights are not configured correctly, organizations can quickly find themselves in a situation where WLM is forced to throttle individual service classes unnecessarily. In the worst-case scenario, this can affect business-critical workloads. CICS or IMS transactions may no longer be processed efficiently, and Db2 timeouts can occur.
A variety of tools can simplify the calculation of LPAR weights. There are organizations that use zPCR and the LPAR Design Tool for this purpose. Many organizations also invest significant effort into performing these calculations themselves using Excel spreadsheets. This preparation is important, but the real question is how to evaluate the success or failure of these calculations in day-to-day operations.
How can you tell in practice whether an LPAR is being underprovisioned by PR/SM? And how can such a bottleneck be identified before it develops into a z/OS performance issue?
LPAR vs. MVS Busy: Identifying issues and drawing the right conclusions
The answer is provided by z/INSIGHT with the LPAR vs. MVS Busy report. It shows how the actual CPU demand of a z/OS LPAR compares to the CPU resources supplied by PR/SM.
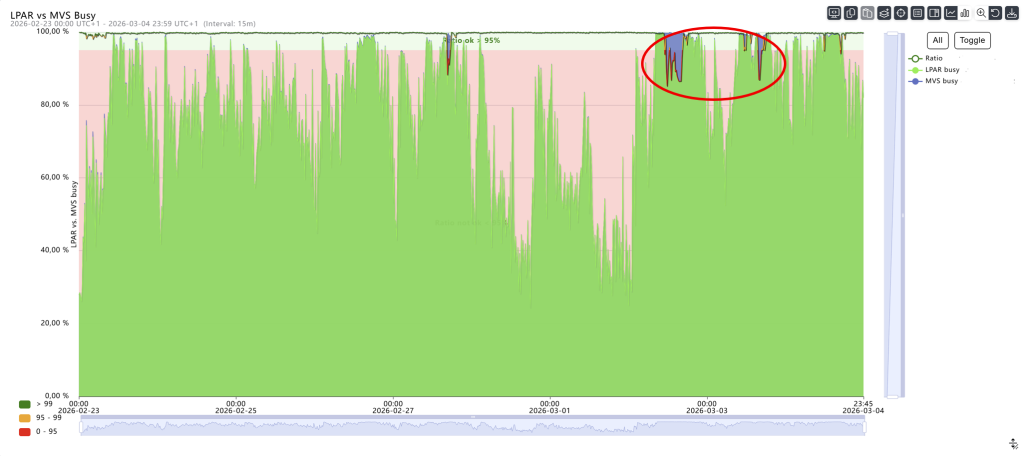
In the example above, two curves can be seen, one positioned behind the other. The blue curve (behind the green curve) shows the z/OS system’s demand for CPU resources. The green curve shows how PR/SM is supplying CPU resources to the LPAR. Ideally, the two curves should be very close to each other (“CPU demand” = supplied by PR/SM), meaning that the LPAR’s requirements are being met almost completely.
If you divide the two values, you obtain a ratio (green line). This ratio should be above 95%, with 100% being the ideal target. In the example shown, a resource shortage occurred on March 3, 2026. With z/INSIGHT, you can zoom in on the chart for a closer look: Using the convenient slider controls on the right and bottom, this can be done very easily (see red arrows).
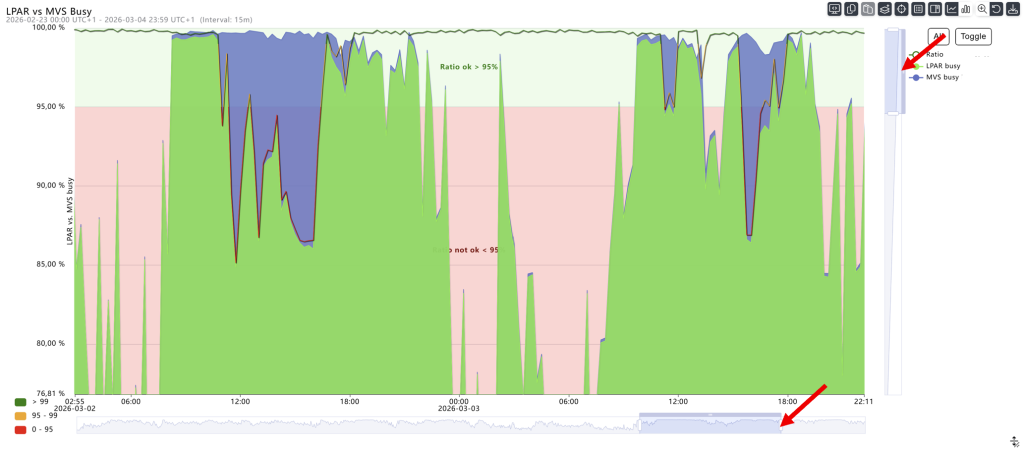
The root cause of the bottleneck has not yet been fully determined. It is clear that z/OS is not receiving sufficient CPU resources, forcing WLM to throttle workloads. In this particular case, we know the customer environment is well-tuned, so only non-time-critical workloads are affected.
The problematic time period can therefore be identified quickly, providing a clear starting point for a more detailed analysis. With z/INSIGHT, this process took only a matter of seconds. By enabling critical timeframes to be identified and isolated rapidly, z/INSIGHT supports data-driven LPAR management and lays the foundation for targeted performance analysis.
Optimizing z/OS: The right metrics for better performance and cost transparency
Maintaining stable z/OS performance requires more than occasional calculations at selected points in time to identify CPU shortages in z/OS operations. Organizations need a graphical tool that clearly shows deviations between CPU demand and the CPU resources supplied. Numbers alone often do not provide the necessary level of transparency.
What is the next step when such a situation occurs? A shortage of CPU resources rarely goes unnoticed in a z/OS environment. Which workloads are being throttled to compensate? Are CICS, IMS, DDF, or WebSphere affected?
We will take a closer look at these questions in the next blog post of this series.
Stay tuned: In the next blog post of our Mainframe Optimization series, we will show how affected workloads in z/OS environments can be analyzed in great detail.